
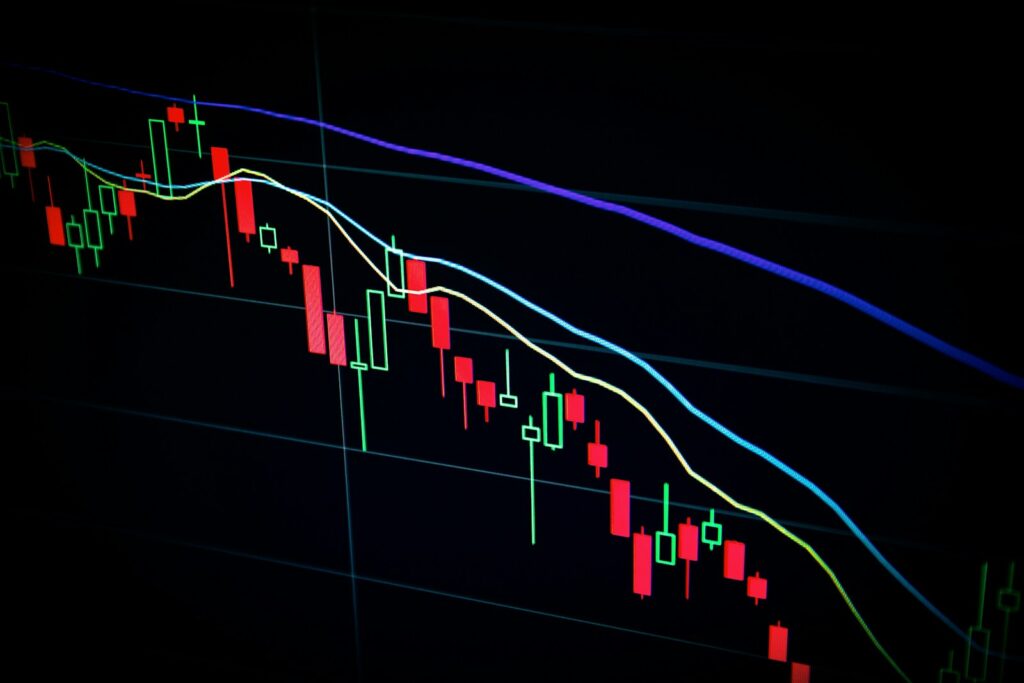
Investors treat markets like rational machines. Yet anyone who has spent time watching markets closely knows that apart from economic growth, inflation, and rate cuts, there is one important element that affects the whole system: emotion
That is where market sentiment enters the conversation. Sentiment indicators attempt to measure how investors feel rather than simply what they are buying. Used carefully, these tools can help investors identify moments when markets may have become excessively optimistic or unnecessarily fearful.
Why Investor Psychology Matters More Than Many People Realize
The effects of investor sentiment were particularly clear in 2026. Investors have swung between enthusiasm over artificial intelligence, anxiety over geopolitical instability, and renewed recession fears within the span of a few months. Markets have reacted sharply to each mood shift, sometimes before the economic data itself fully changed direction.
This is called collective psychology. When confidence rises, investors become more willing to tolerate risk. Valuations change. Stories about transformative technologies or “new eras” started making headlines.
The opposite happens during periods of stress. Investors rush toward cash, government bonds, and defensive sectors. Riskier assets can fall sharply, even if the underlying businesses remain relatively stable.
This dynamic is hardly new, but the speed of the sentiment change is now affected by social media platforms, trading communities, and algorithmic trading systems, which amplify market reactions far more quickly than in previous decades.
The Fear & Greed Index
One of the most widely followed sentiment indicators is the CNN Fear & Greed Index, which aggregates several market measures into a single score ranging from 0 to 100.
The index incorporates stock price momentum, market volatility, demand for safe-haven assets, options activity, and other signals designed to measure investor behavior rather than economic fundamentals. Lower readings indicate fear, while higher readings suggest optimism.
Earlier in 2026, the index briefly fell into “extreme fear” territory as markets reacted to rising geopolitical tensions and renewed volatility in energy prices. By May, sentiment had swung back toward greed as equity markets recovered.
The importance of such indicators lies in what extreme readings may imply. Historically, periods of extreme fear have coincided with attractive long-term entry points. Conversely, periods of excessive optimism sometimes precede market pullbacks because expectations become difficult to satisfy.
This does not mean investors should automatically buy whenever fear spikes or sell whenever greed rises. Sentiment indicators are better viewed as warning signs than trading instructions.
Retail Sentiment Surveys
Another closely watched measure comes from the American Association of Individual Investors, AAII in short, which publishes a weekly sentiment survey tracking whether retail investors feel bullish, bearish, or neutral about the next six months of market performance.
While retail sentiment alone does not drive markets, sharp swings in investor expectations can reveal how emotionally tense the market may be becoming. If nearly everyone expects markets to continue rising, much of the buying enthusiasm may already be reflected in prices. Likewise, when pessimism becomes widespread, investors may have already sold much of what they intended to sell.
Contrarian investing is built around this principle. Experienced investors use this method of investment when they recognize that collective emotion may have pushed valuations too far in one direction.
Volatility Indexes
Using volatility indicators is another way to monitor market sentiment. Frequently referred to as Wall Street’s “fear gauge”, the VIX index measures expected volatility in the S&P 500 based on options pricing. When investors become anxious and seek downside protection, the VIX tends to rise.
Elevated volatility does not necessarily signal an imminent crash. It simply indicates that investors expect larger price swings ahead.
Interestingly, volatility spikes often coincide with periods when long-term investors begin finding opportunities. Panic rarely produces rational pricing.
This is psychologically difficult to put into practice. Buying when markets feel unstable is uncomfortable by definition. Yet some of the strongest long-term returns historically have emerged after periods of heightened fear.
Artificial Intelligence Is Creating New Sentiment Cycles
Enthusiasm surrounding AI infrastructure, semiconductors, and automation software has fuelled substantial gains across parts of the technology sector. At times, investor optimism has become so intense that some analysts have begun comparing aspects of the current environment to previous speculative cycles.
According to a recent Morgan Stanley report, while AI-related investment continues supporting markets, pockets of excessive optimism have emerged in certain sectors.
This illustrates one of the most useful applications of sentiment analysis: identifying when narratives become stronger than valuation.
Strong themes can absolutely reshape economies and generate genuine long-term investment opportunities. But investor enthusiasm often moves faster than underlying financial performance.
To step back from the excitement and follow sentiment-related indicators in real time, investors use charting platforms such as TradingView. The platform allows users to monitor the VIX, market breadth, momentum indicators, and custom sentiment dashboards within a single interface, making it easier to spot changes in investor behavior as they develop.
Learn to Read the Mood Behind the Numbers
Economic indicators, earnings reports, and central bank policy remain essential parts of investing. Yet market participants are people, and people are emotional.
Market sentiment data offers investors a way to observe emotional currents more objectively. Fear & Greed indexes, volatility measures, and investor surveys cannot predict the future with precision, but they can reveal when optimism or panic may be distorting prices.
For investors attempting to navigate increasingly fast-moving markets, that perspective may prove more valuable than ever.
Photo by Maxim Hopman: Unsplash
More For You
- Latte factor calculator: Just $5 a day could cost you a million bucks
- The stock market vs. the economy: Why they’re different and what it means for you
- Top 5 EdTech Development Firms for Custom Learning Platforms
- Gains and losses: what will be taxed and what can I claim?
- What to do when you get a surprise medical bill you can’t afford
- How to finance a car (the smart way!)
- What’s your credit utilization ratio and how does it affect your credit score?
- Should you invest in real estate crowdfunding?